From February to August 2026, Uber reported rapid growth in agentic usage while AI spend broadly stabilized. We wondered if there was a "poor man's" version of Uber's approach, that even smaller teams could deploy.
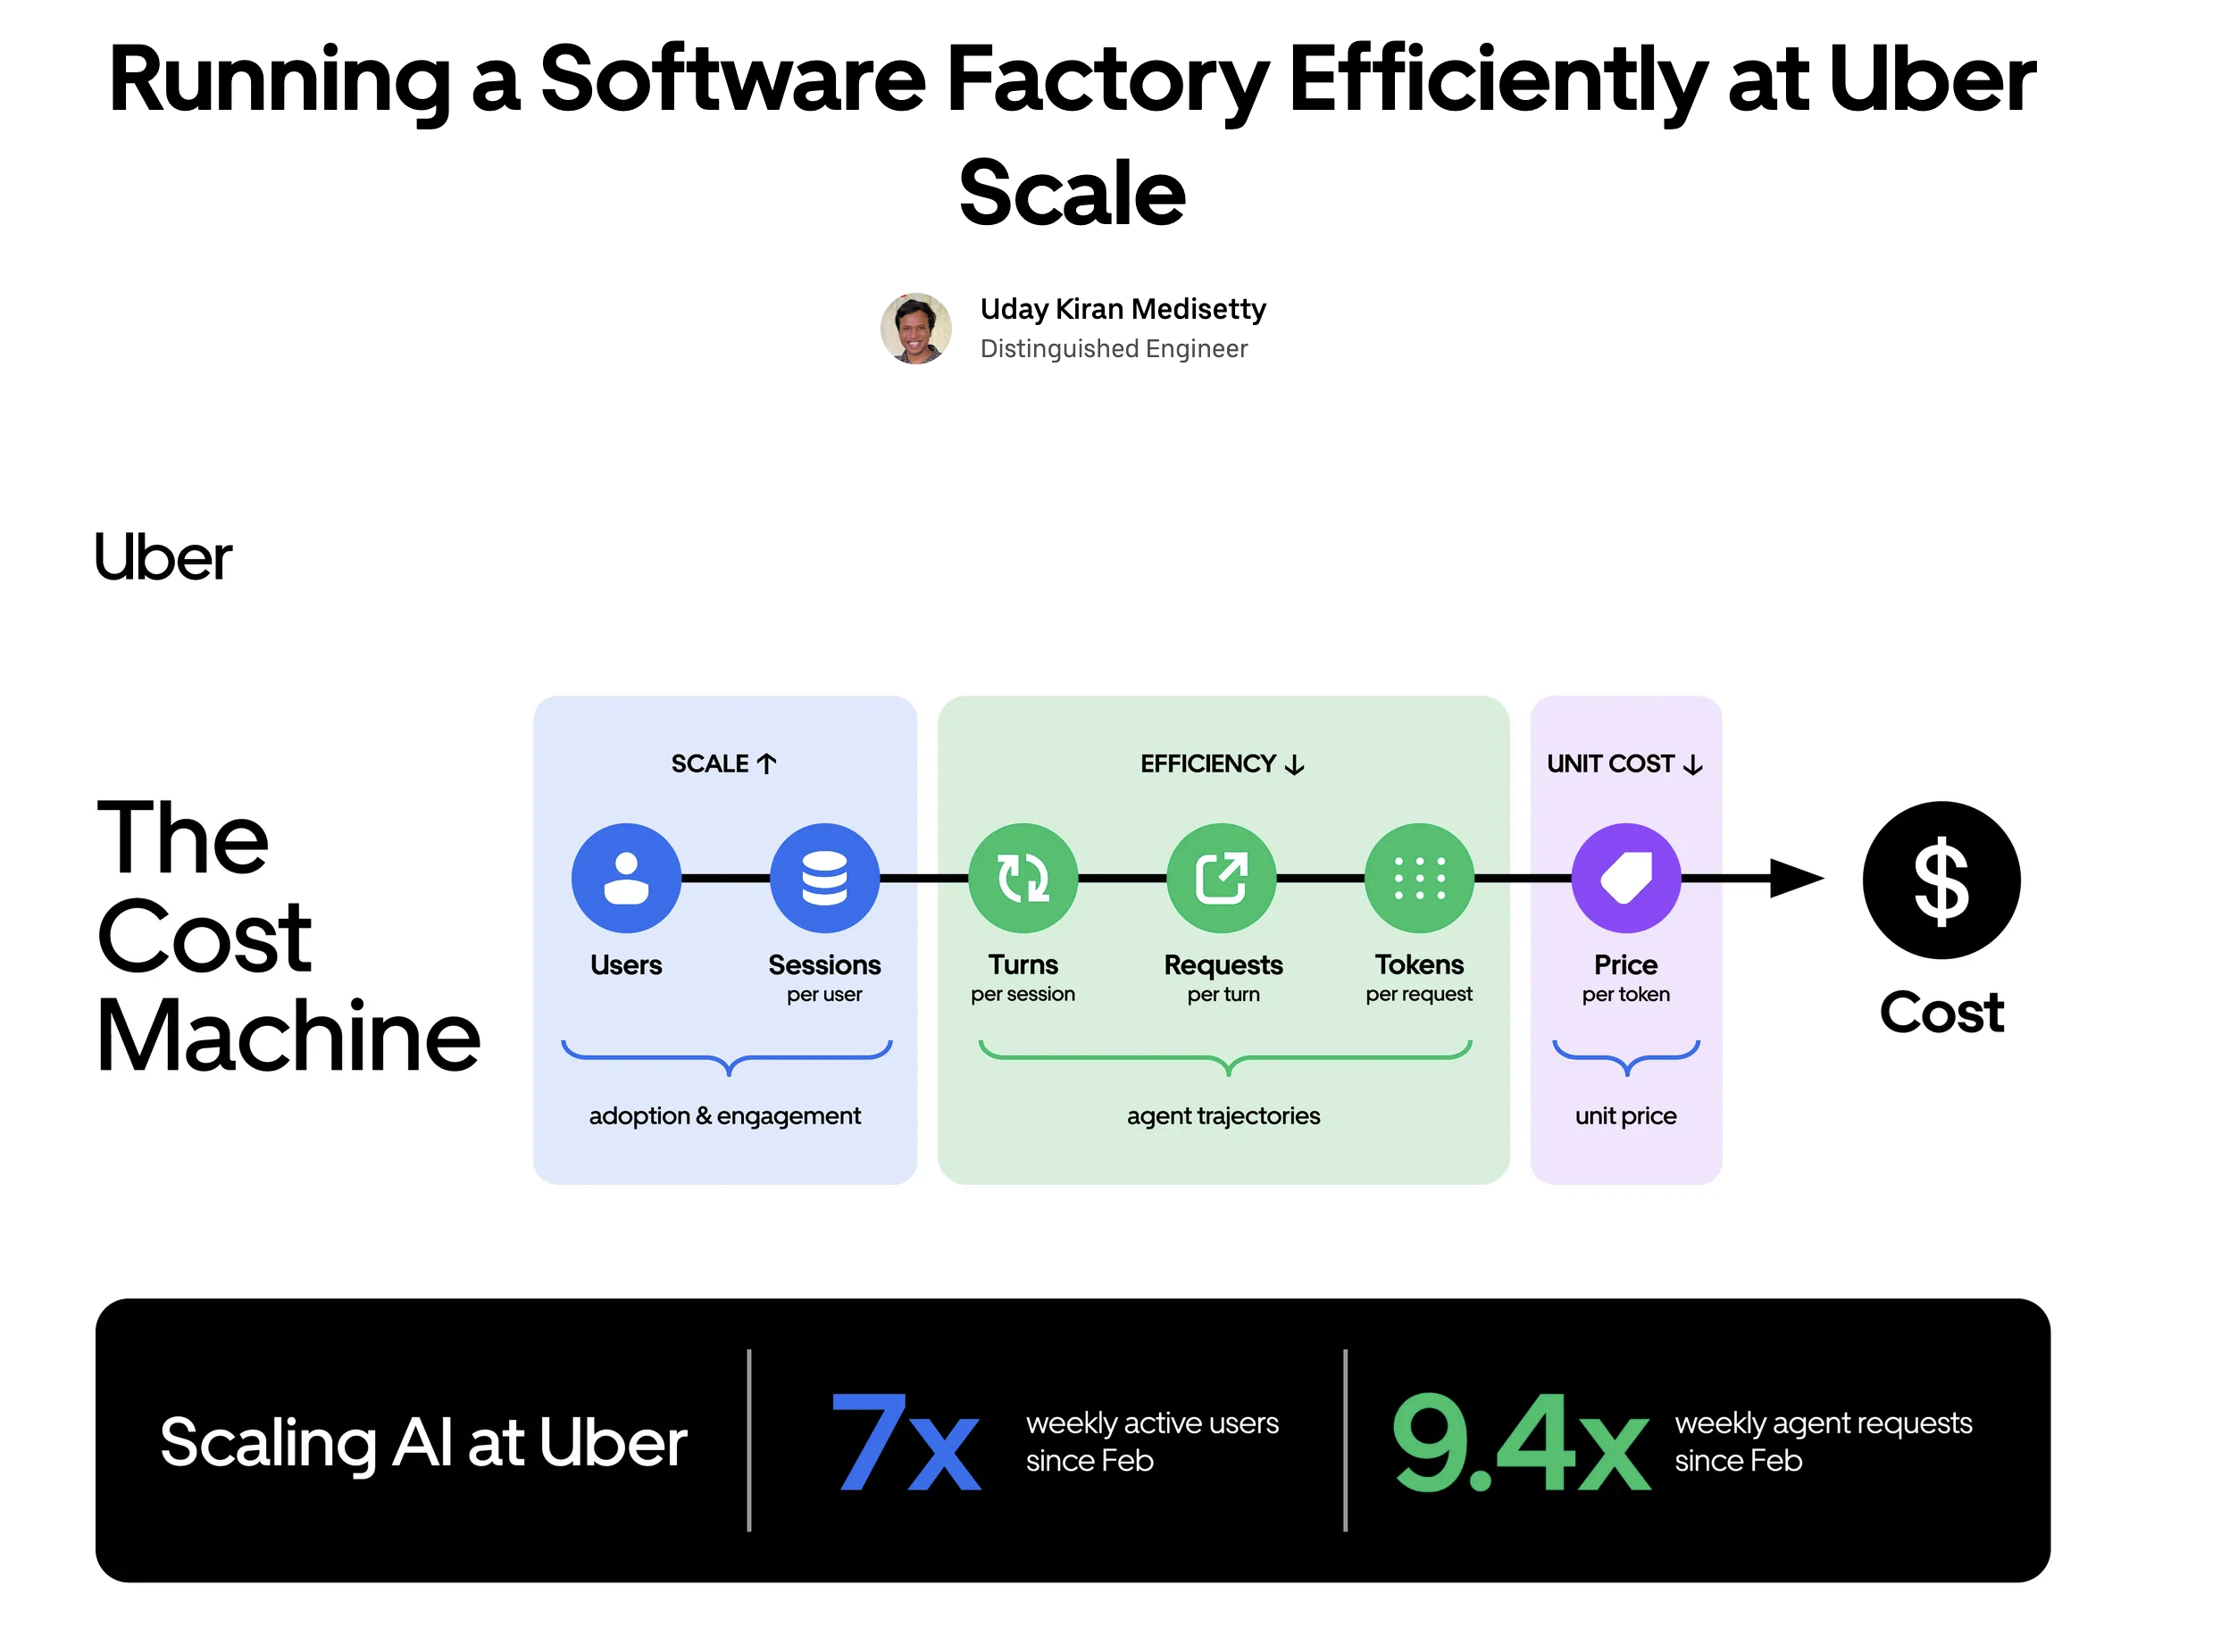
Holding the model constant, Uber reports that cost per 1,000 requests fell almost 34% from peak. More than 70% of pull requests are attributed to local or cloud agents. Those results point to five operating questions that any AI factory can turn into a scorecard.
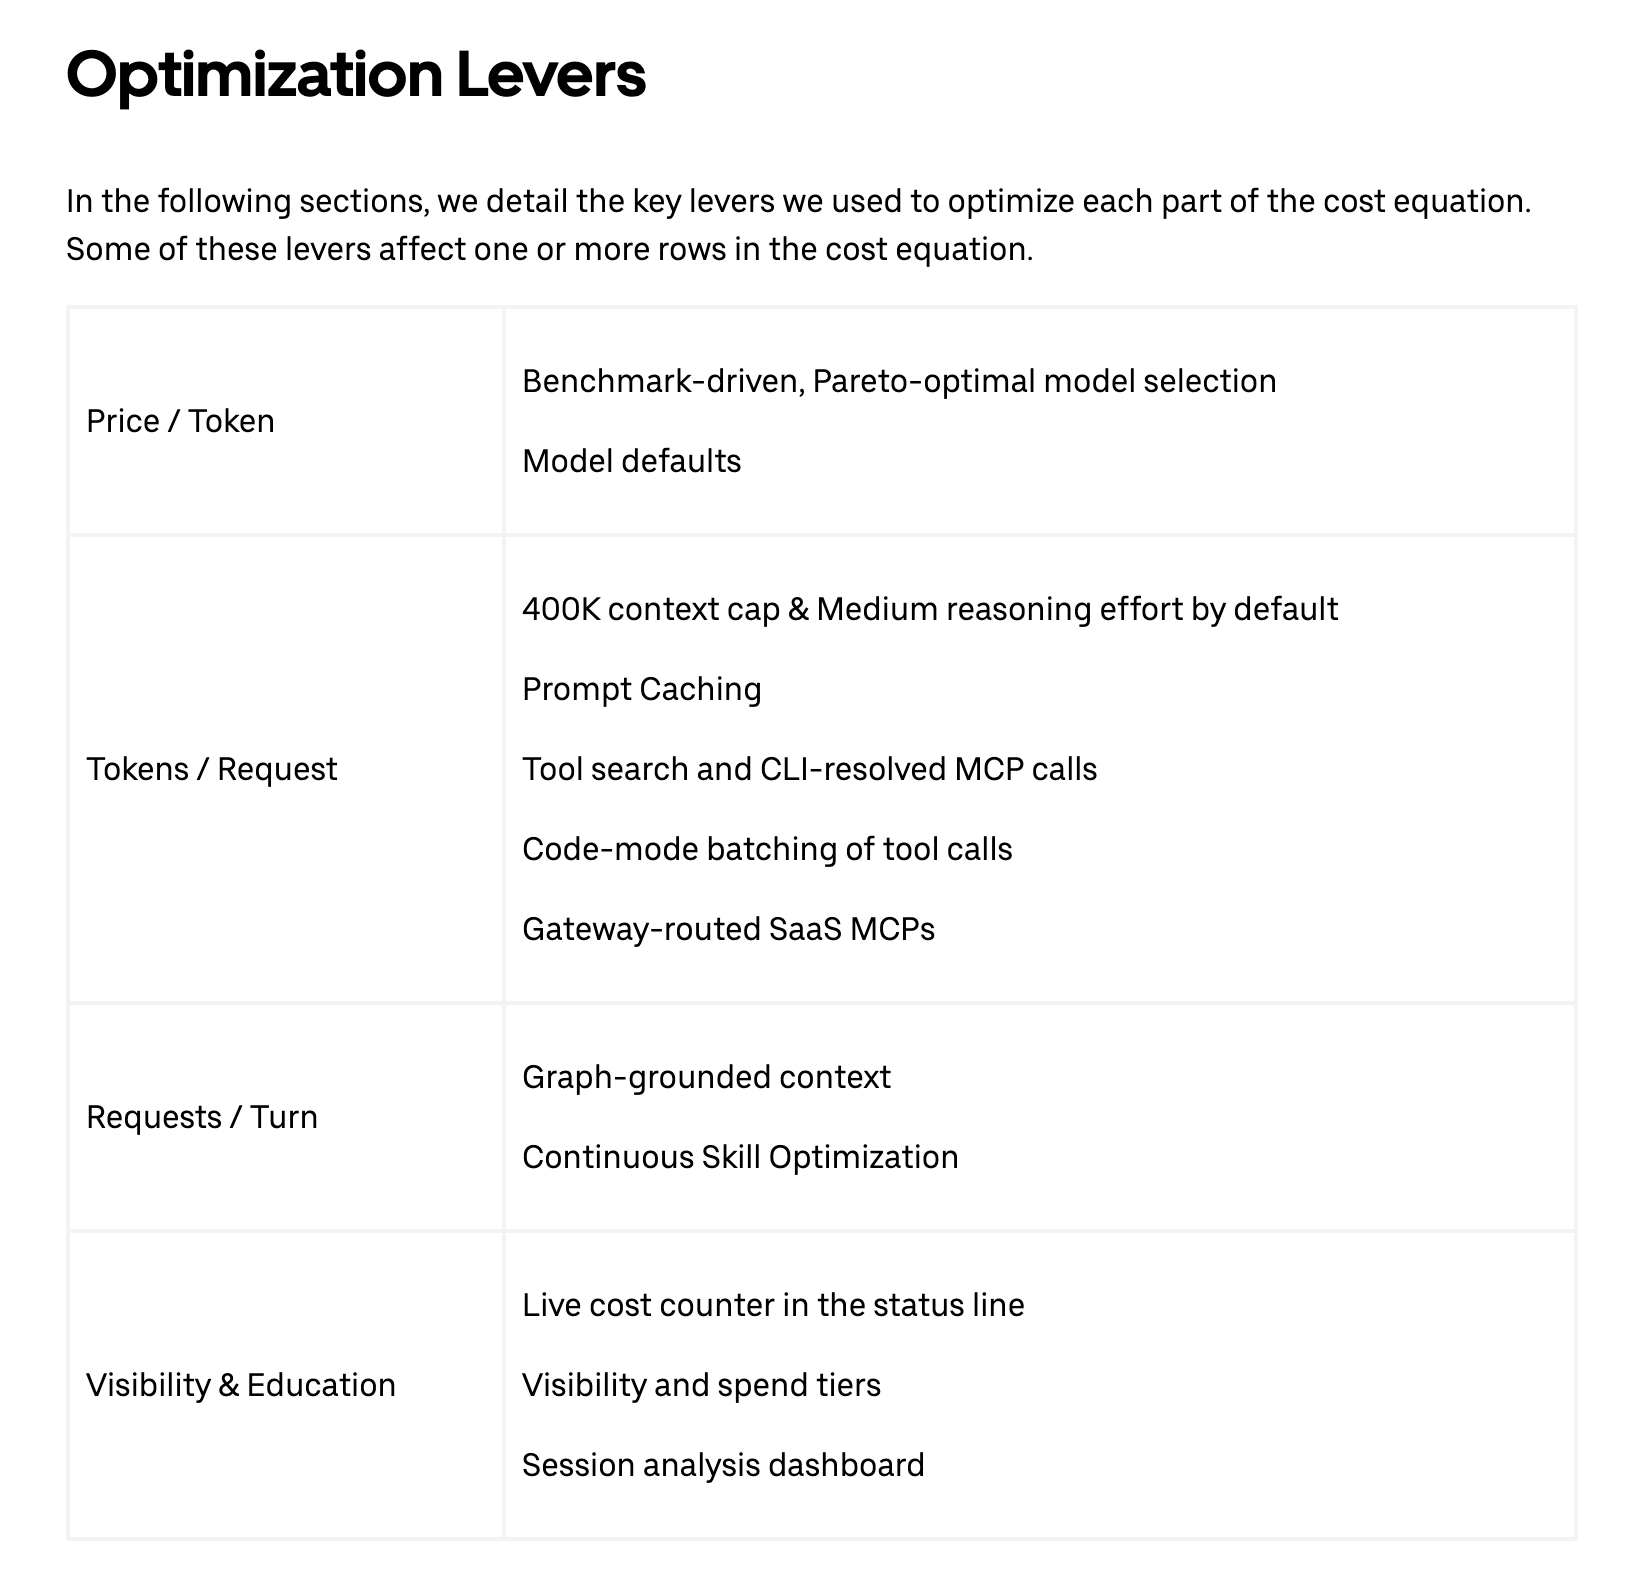
Explore Uber’s optimization levers
1. Can we attribute token spend to managed agents with outcomes?
Uber recognized that it wanted usage to go up (users, sessions), with session costs dropping much faster, and outcomes improving overall. Tracking spend by agent and tool offered the right leverage point. Ideally managed agents deliver outcomes like merged PRs, which makes cost per managed outcome (cost per merged PR, cost per review, cost per alert, cost per cleanup) easier to report on in the future.
2. Can we measure cost per successful outcome?
Useful unit metrics include $/merged PR, $/review, $/alert and $/cleanup, paired with quality measures such as revert rate, F1 (a measure of precision and recall - low false positives and false negatives) and MTTR (Mean Time to Resolution). Other companies may use $/resolved ticket or $/successful workflow.
3. Is the same work using fewer tokens?
Efficiency comes from reducing unnecessary context, excessive turns, cache misses, oversized tool payloads and unnecessary frontier-model use. Uber reported 55–71% lower token consumption in several code-mode database-query tests, with some bulk workflows exceeding 90% savings.
4. Is each workload using the right execution package?
The optimization unit is model + configuration + context + tools + skills + routing + runtime policy. AT&T applies a similar approach at roughly 45 billion tokens per day, using cache-aware routing based on expected quality, speed and cost.
5. Does execution create reusable operating knowledge?
Caching avoids paying repeatedly for the same context. Skills capture validated methods for repeated work. Uber’s 3,600+ skills and 30,000+ daily executions show how operating knowledge becomes reusable infrastructure.
The TokenOps and RunTime control loop
This is the connection to TokenOps and RunTime. TokenOps provides the economic ledger: where token capital went, what workload consumed it, and what outcome it produced. RunTime is the execution layer where models, context, tools, skills, routing and policy are configured and improved.
The objective is not Uber-scale infrastructure. It is the same management discipline: attribute spend, measure unit cost, reduce repeated token use, benchmark execution, and convert successful operating knowledge into reusable assets.
Source and interpretation. Uber, “Building an Efficient Software Factory”, 2026, is the source for the reported usage growth, cost trends, pull-request attribution, skill counts and token-reduction examples. AT&T, “The Tokenomics Equation: Balancing Cost and Performance,” is the source for the 45-billion-token daily volume and cache-aware routing approach. This article is Proverify.ai’s interpretation of their implications for AI operating design; neither company endorses Proverify.ai, TokenOps or RunTime.